High-peak-power electro-optically Q-switched laser with a gradient-doped Nd:YAG crystal: Part 3
[Cited from: OPTICS LETTERS, Authors: Meng-En Wei, etc.]
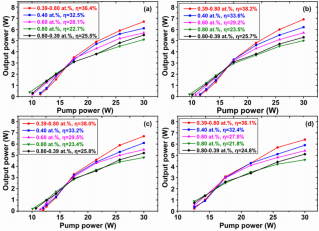
The Q-switched laser performance with different doping levels and different transmissions of OCs are shown in Fig. 2. The maximum output power for the gradient-doped Nd:YAG crystal amounted to 6.9 W at an incident pump power of 30 W for a 45% OC. The corresponding slope efficiency was 38.2%. The maximum average output power for the uniform dopant crystal was 5.7 W with the doping level of 0.60 at.% for a 45% OC. The corresponding slope efficiency was 29.2%. In this case, the slope efficiency and maximum output power of the crystal with a gradient concentration of0.39–0.80 at.% were enhanced by 30.8% and 21.1%, respectively, compared to the uniform dopant crystal.
Fig. 2. Output performance with respect to the different transmittance of OCs: (a) TOC = 40%, (b) TOC = 45%, (c) TOC = 50%, and (d) TOC = 55%.
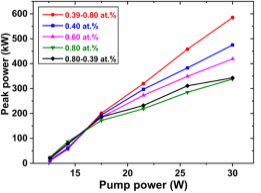
The peak power varied with the pump power for each crystal, plotted with a 45% OC, as shown in Fig. 3. It can be seen that for the crystals with a higher doping level of 0.80 at.% and 0.80–0.39 at.%, their peak powers were higher than the rest of the crystals when the pump power was below 17 W. With the increase in pump power, the peak power o crystals with concentrations of 0.39–0.80 at.%, 0.40 at.%, and 0.60 at.% increased significantly compared to the two higher doped crystals. When the pump power was 30 W, the peak power of the gradient- doped crystal was 585 kW, which was 23.2% and 39.6% higher than those of crystals with concentrations of 0.40 at.% and 0.60 at.%, and their peak powers were 475 kW and 419 kW, respectively. The peak powers of crystals with concentrations of 0.80 at.% and 0.80–0.39 at.% were only 338 kW and 343 kW, respectively.
Fig. 3. Peak power of EO Q-switched Nd:YAG laser with respect to pump power for TOC = 45%.
Figure 4 exhibits the measured near-field beam profile and beam propagation of the gradient concentration of 0.39- 0.80 at.% at a pump power of 30 W. The beam profile of the Q-switched laser maintained a near-diffraction-limited Gaussian intensity distribution with measured beam propagation factors (M2) of 1.38 and 1.28 in horizontal and vertical directions, respectively.
Fig. 4. Measured near-field beam profile and beam propagation factor at a pump power of 30 W for the gradient-doped crystal.
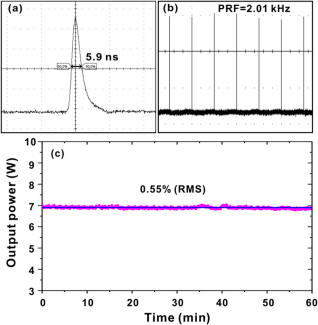
The shortest pulse duration for the gradient-doped crystal was 5.9 ns, measured at a pump power of 30 W, and the PRF was 2.01 kHz, as shown in Figs. 5(a) and 5(b). The measured average output power stability of the Q-switched laser for the gradient-doped crystal in ~ 1 h was 0.55% (RMS), as shown in Fig.5(c).
Fig. 5. (a) Measured temporal trace for the EO Q-switched Nd:YAG laser with gradient-doped crystal at maximum pump power; (b) corresponding pulse train; (c) power stability over 1 h.
In summary, a gradient-doped Nd:YAG crystal with a continuously varying dopant concentration profile of 0.39–0.80 at.% was adopted as the gain medium for an EO Q-switched laser at 2 kHz. The average output power was significantly improved compared to using uniform dopant Nd:YAG crystals (www.wisoptic.com). The results indicate that the gradient dopant crystal has a lower thermal effect and more uniform absorption, which is helpful in obtaining a higher pulse energy from a Q-switched DPSSL. The incident end of the gradient crystal produced less heat, and the middle and end parts enabled the crystal to obtain high efficiency. With a 45% OC, the maximum peak power of the gradient crystal was increased by 39.6% compared with the equivalent uniformly doped crystal. The Nd:YAG pulsed laser emitted a near-diffraction-limited laser beam with measured beam propagation factors (M2) of 1.38 and 1.28 in horizontal and vertical directions, respectively. Our results indicate that the gradient-doped Nd:YAG crystal is more promising for application in high-average-power and high-pulse-energy nanosecond DPSSL systems working at high repetition rates.
Post time: Feb-28-2022


